Jared E. Decker and Jeremy F. Taylor
Animal breeding can be viewed from the perspective of three basic categories: recording matings, predicting the outcome of matings, and planning future matings. Thus, ancestry is a central and integral part of animal breeding, and breeders have had an inherent interest in ancestry since at least the time of
Robert Bakewell (1725-1795). Until recently, we could only trace ancestry as far back as we had pedigree records. But, with the advent of DNA technologies we are now able to infer the extent of relationships among individuals separated by hundreds, thousands, and even millions of years – i.e., the individuals are from different species.
In 2009, we
published research that describes the relationships between 48 different breeds of cattle and the relationships between cattle and other ruminant species. We used a recently developed DNA analysis kit, called the Illumina BovineSNP50 BeadChip, to survey approximately 50,000 sites among the entire 3 billion DNA bases present in cattle (referred to as the genome). By genotyping a sample of individuals from each breed we can use this information to identify which breeds of cattle are most similar and which must have the most recent common ancestor. One example of a group of breeds that share recent common ancestry is the descendants of the Durham Shorthorn. In the “family tree” of cattle breeds (Figure 2 of our PNAS publication and close-up as Figure 1 of this article), we see that the Belgian Blue, Maine-Anjou, American Shorthorn and Lincoln Red breeds all share a recent common breed ancestor (point A in Figure 1). From our knowledge of breed histories, we can infer that the related ancestors in breed A are Durham Shorthorns. Furthermore, this figure also shows that Lincoln Reds and American Shorthorns are more similar to each other than they are to the Maine Anjou and Belgian Blue breeds (point B in Figure 1).
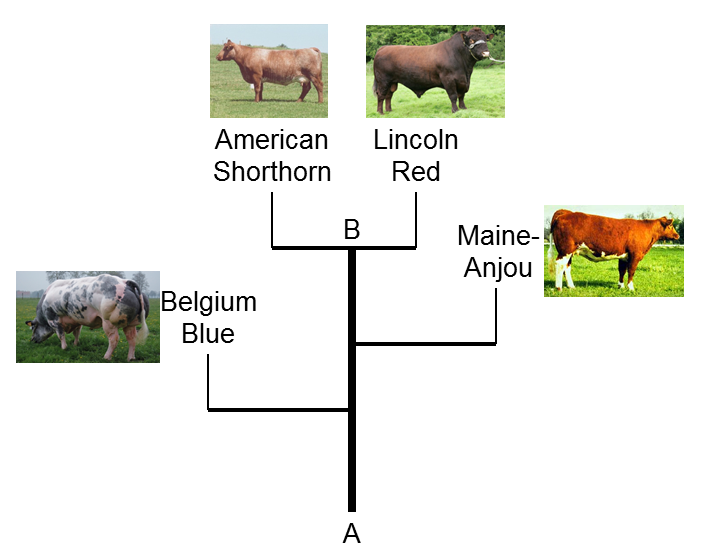 |
| Figure 1. Family Tree of Durham Shorthorn descendants. Branches are not drawn to genetic distance scale. |
Using DNA markers we can also examine relationships between animals within a breed. The American Shorthorn Association registers animals that have at least 15/16 Shorthorn blood. Animals with a smaller faction of Shorthorn ancestry can be registered in the ShorthornPlus registry. Some Shorthorn breeders have designated the term “Native Shorthorn” to indicate animals whose entire ancestry can be traced back to the 1822 Coates herd book or the 1830 Clay importation into the USA without any other outside influence.
With the help of Roy Lovaas we collected 108 DNA samples from 5 different populations and genotyped these samples with the BovineSNP50 BeadChip to evaluate how distinct Native Shorthorns are from other Shorthorn populations and breeds commonly used to generate ShorthornPlus cattle. We used a statistical procedure called Principal Component Analysis to identify components (unobserved factors which measure similarity and differences among individuals) that represent, in decreasing order of importance, the greatest amount of variation between the animals’ genotypes. We can then plot the first two principal component values for each genotyped animal to examine how the animals cluster according to the sources of variation within their genomes (Figure 2). The American Shorthorn samples (blue dots) are spread throughout the plot, indicating the large amount of variation within the group, likely due to the presence of DNA from other breeds within these animal’s genomes resulting from an open herd book. Within the Native Shorthorns (purple dots) and Lincoln Reds (red dots) individuals are clustered much more closely together indicating that the individuals within these groups are more closely related than are individuals within Shorthorns in general. Also notice that the Native Shorthorn and the Lincoln Red clusters lie physically close to one another indicating genetic similarity and a relatively recent common ancestry. While the BovineSNP50 DNA markers primarily represent the common variation within the cattle genome and the sample sizes are small for some of the groups, it is still possible to identify patterns of relationship within these data. Due to the closed breeding programs, Native Shorthorns and Lincolns Reds form distinct populations of cattle, but they are both closely related and trace their ancestry to Durham Shorthorns.
 |
| Figure 2. Plot of the first two Principal Component values for each animal. |
While breeds may share a recent common ancestry, they can be quite different phenotypically. The descendants of Durham Shorthorns provide a very good example of closely related individuals which substantially differ phenotypically. In this group there are double-muscled Belgian Blues and light-muscled Milking Shorthorns. Lincoln Reds are solid colored and Shorthorns can be white, red, roan or a combination of the three. Shorthorns may be horned, polled or scurred. Milking Shorthorns produce large volumes of milk, while Beef Shorthorns have moderate amounts of milk. These are just some of the examples of phenotypic differences that result from the forces of artificial selection. Thus, even though two populations may be closely related, they may differ phenotypically because a relatively small number of genes of large effect cause the divergence. Rapid genetic progress has been made in many breeds through the process of artificial selection using phenotypic selection and estimated breeding values to improve economically important traits.
This brings us to another important application of the new genetic marker technologies- the implementation of
Genomic Selection. While the details of Genomic Selection are far beyond the scope of this article, a brief explanation is beneficial. In traditional breeding value calculations, the pedigree relationship matrix is used to represent the extent to which two individuals share genes that are identical by descent. Or another way to look at this is that the pedigree relationship coefficient represents the extent to which the genomes of two individuals are identical because they were inherited from common ancestors. Cattle, like all animals, receive half of their genetic material from their sire and half from their dam. So, on average, they also receive one quarter of their genetic material from each of their paternal grandsire, paternal granddam, maternal grandsire, and maternal granddam. However, as a consequence of the random shuffling of chromosomes during the formation of eggs and sperm, the actual contribution from each of the grandparents may vary considerably from these averages. With the use of the new DNA marker technologies we can precisely identify the actual fractions of the animal’s genetic material that were received from each grandparent. This actually facilitates a much more accurate prediction of genetic merit at a much earlier age. By taking a DNA sample at birth and genotyping the sample with the BovineSNP50 BeadChip, we can immediately estimate the genetic merit of the animal for the traits that are routinely recorded and possibly also for traits that have been recorded in experimental populations such as for feed efficiency and meat tenderness. Genomic Selection has been fully implemented in the U.S. dairy industry and is slowly gaining traction in the beef industry.
Applying these new DNA marker technologies has increased our ability to more precisely establish ancestry all the way from the species level down to familial relationships between grandparents and their grandprogeny. This information is not only interesting from an historical perspective, but it informs the design of new Genomic Selection programs. These technologies also allow us as animal breeders to more accurately identify relationships arising from previous matings, estimate genetic merit of progeny from current matings, and more precisely plan future matings.


Comments