by Ryan Boldt, Director of Breed Improvement, RAAA
Selection for carcass trait performance is important to keep in mind when making bull-purchasing decisions. Most carcass traits are moderately heritable in nature. In seedstock animals, the best method to collect information about carcass-trait performance is through the use of ultrasound imagining.
Generally, ultrasound information is collected on seedstock animals at a year of age. When an ultrasound is collected, up to four measurements are taken. The most common measurements recorded include intramuscular fat, backfat, and rib eye area which serves as the best indicators for carcass marbling score, carcass back fat and carcass ribeye area.
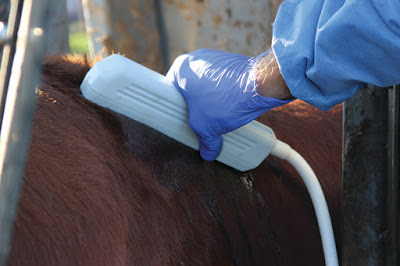
The ultrasound information is collected via a probe that emits high-frequency sound waves. The probe is placed on the animals back and an image is created that shows the difference between different tissues under the animal’s hide. These images are captured by a certified ultrasound technician and then sent to an ultrasound processing lab that analyzes the images and records the measurements.
In the genetic evaluation, ultrasound and actual carcass records are combined in a multiple-trait analysis. EPDs for carcass traits are calculated using two multiple trait analyses. In one analysis the Marbling and Back Fat EPD are produced. In the second analysis the Carcass Weight and Rib Eye Area EPDs are calculated. In both analyses, the data on carcass records and ultrasound information is used simultaneously through the genetic correlation between the traits. This genetic correlation between carcass and ultrasound measurements are moderate to high in nature. This means that many of the genetics that drive expression of the ultrasound indicator are the same as the carcass expression of the trait.
In the following figures, genetic trends for animals born from 2000 to 2018 are shown for three groups of animals. The grey line represents seedstock animals that have ultrasound and genomic test information, the blue line represents animals that have ultrasound information but have not had a genotype available for the analysis, and the orange line represents animals that do not have any ultrasound or genomic data recorded. For all three groups, the trends show movement in a favorable direction, however, there are differences in the improvement of EPDs over this 18-year time period.
For all three traits, we compare the difference in the average EPD values from animals born between 2000 and 2018 that have an ultrasound record (blue line) versus animals that were not ultrasound scanned or had genotype information (orange line). The trends show that the animals with recorded ultrasound data had an improvement of 0.01 Marbling scores, 0.03 inches squared, and -0.02 inches for Marbling, Rib Eye Area, and Back Fat EPDs over animals that did not have that data recorded during that time frame.


Genotype information was first available to Red Angus members in 2012. Hence for that group, the genetic trend lines are not as consistent as the other groups that contain more records prior to 2012. If we compare the trends for animals that have genotype and ultrasound information since 2012 to animals that do not have either piece of data recorded, the trend shows advantages in average EPD of 0.02, 0.02, and -0.001 for Marbling, Rib Eye Area, and Back Fat, respectfully. Looking at the advantages in the different EPD changes over time show the advantage of collection and recording data for carcass traits on seedstock animals. By recording this information, it allows for increased accuracy of selection and more rapid genetic improvement for carcass traits.


Comments
Via Email : chiefdrlucky@gmail.com
Thank you all for reading,
God bless"